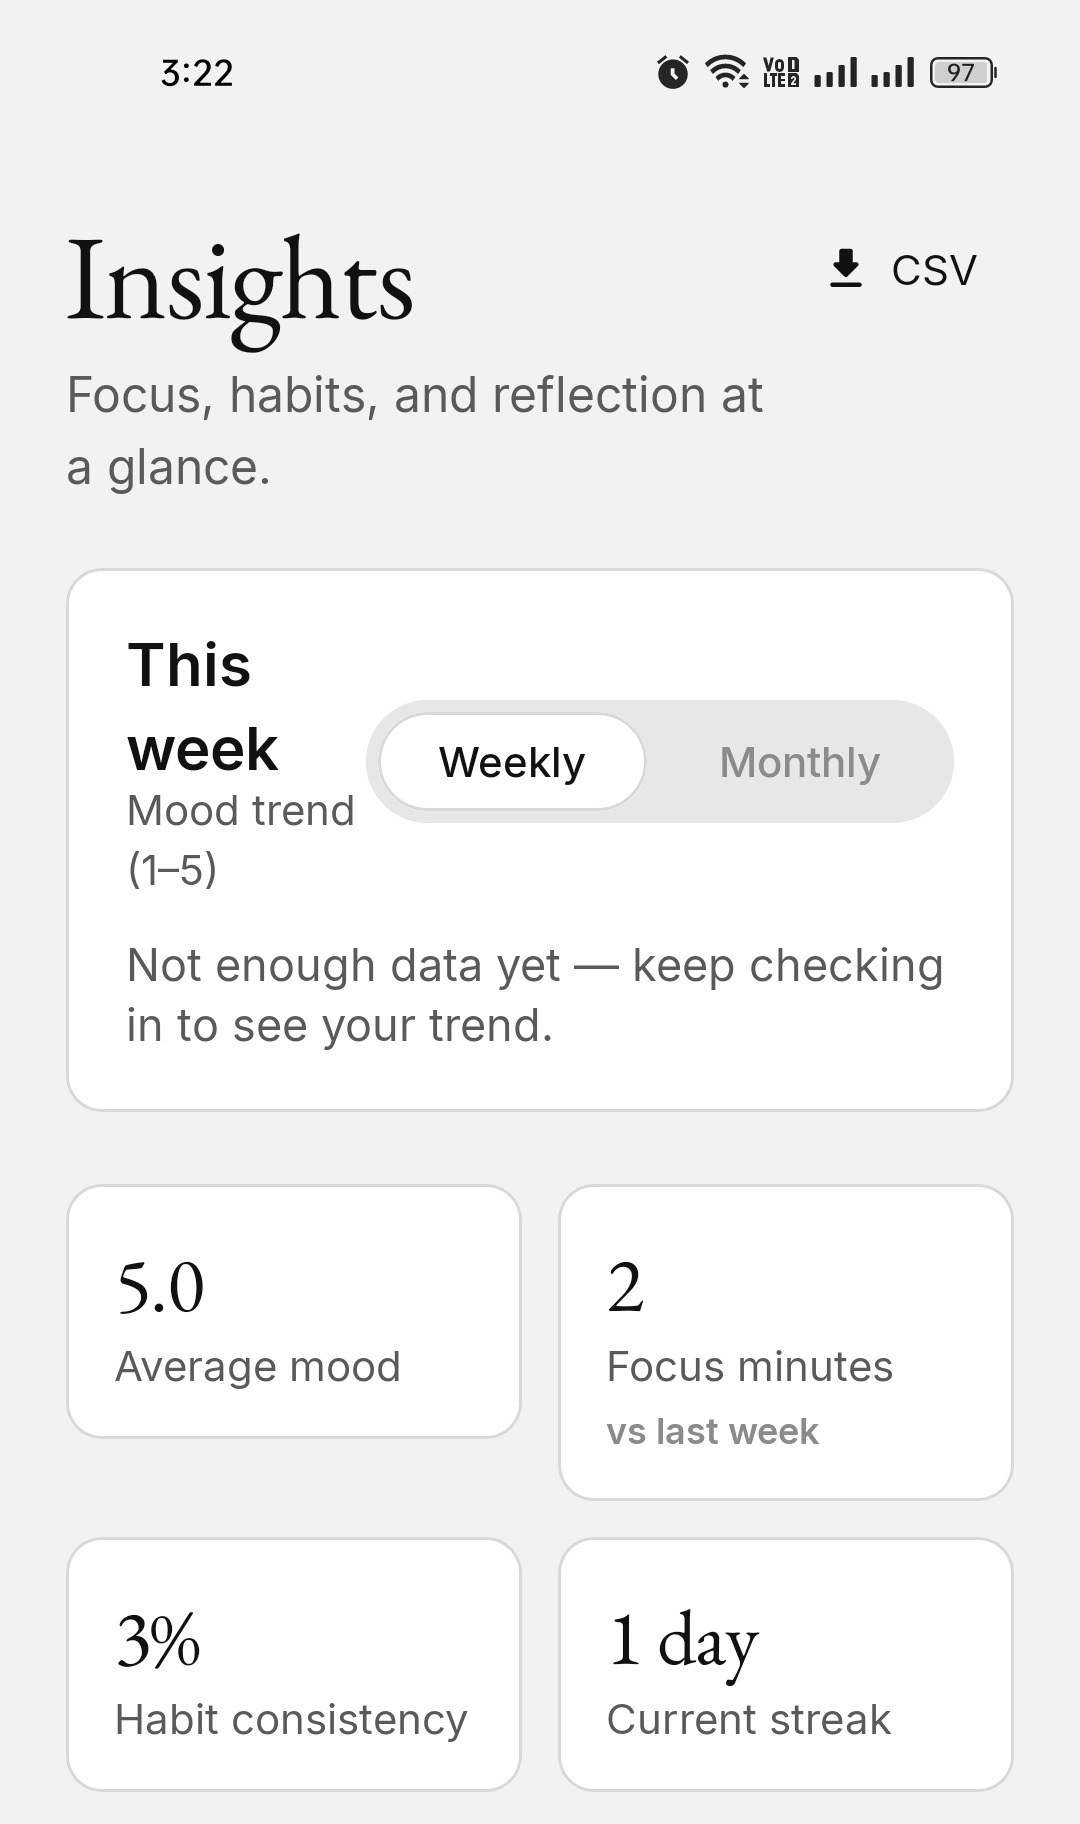
Insights
Understand your patterns — privately
Every chart in KaiZenly+ is calculated on your device. No server processes your habits, moods, or focus history. You just open the Insights tab and see how your small steps add up.
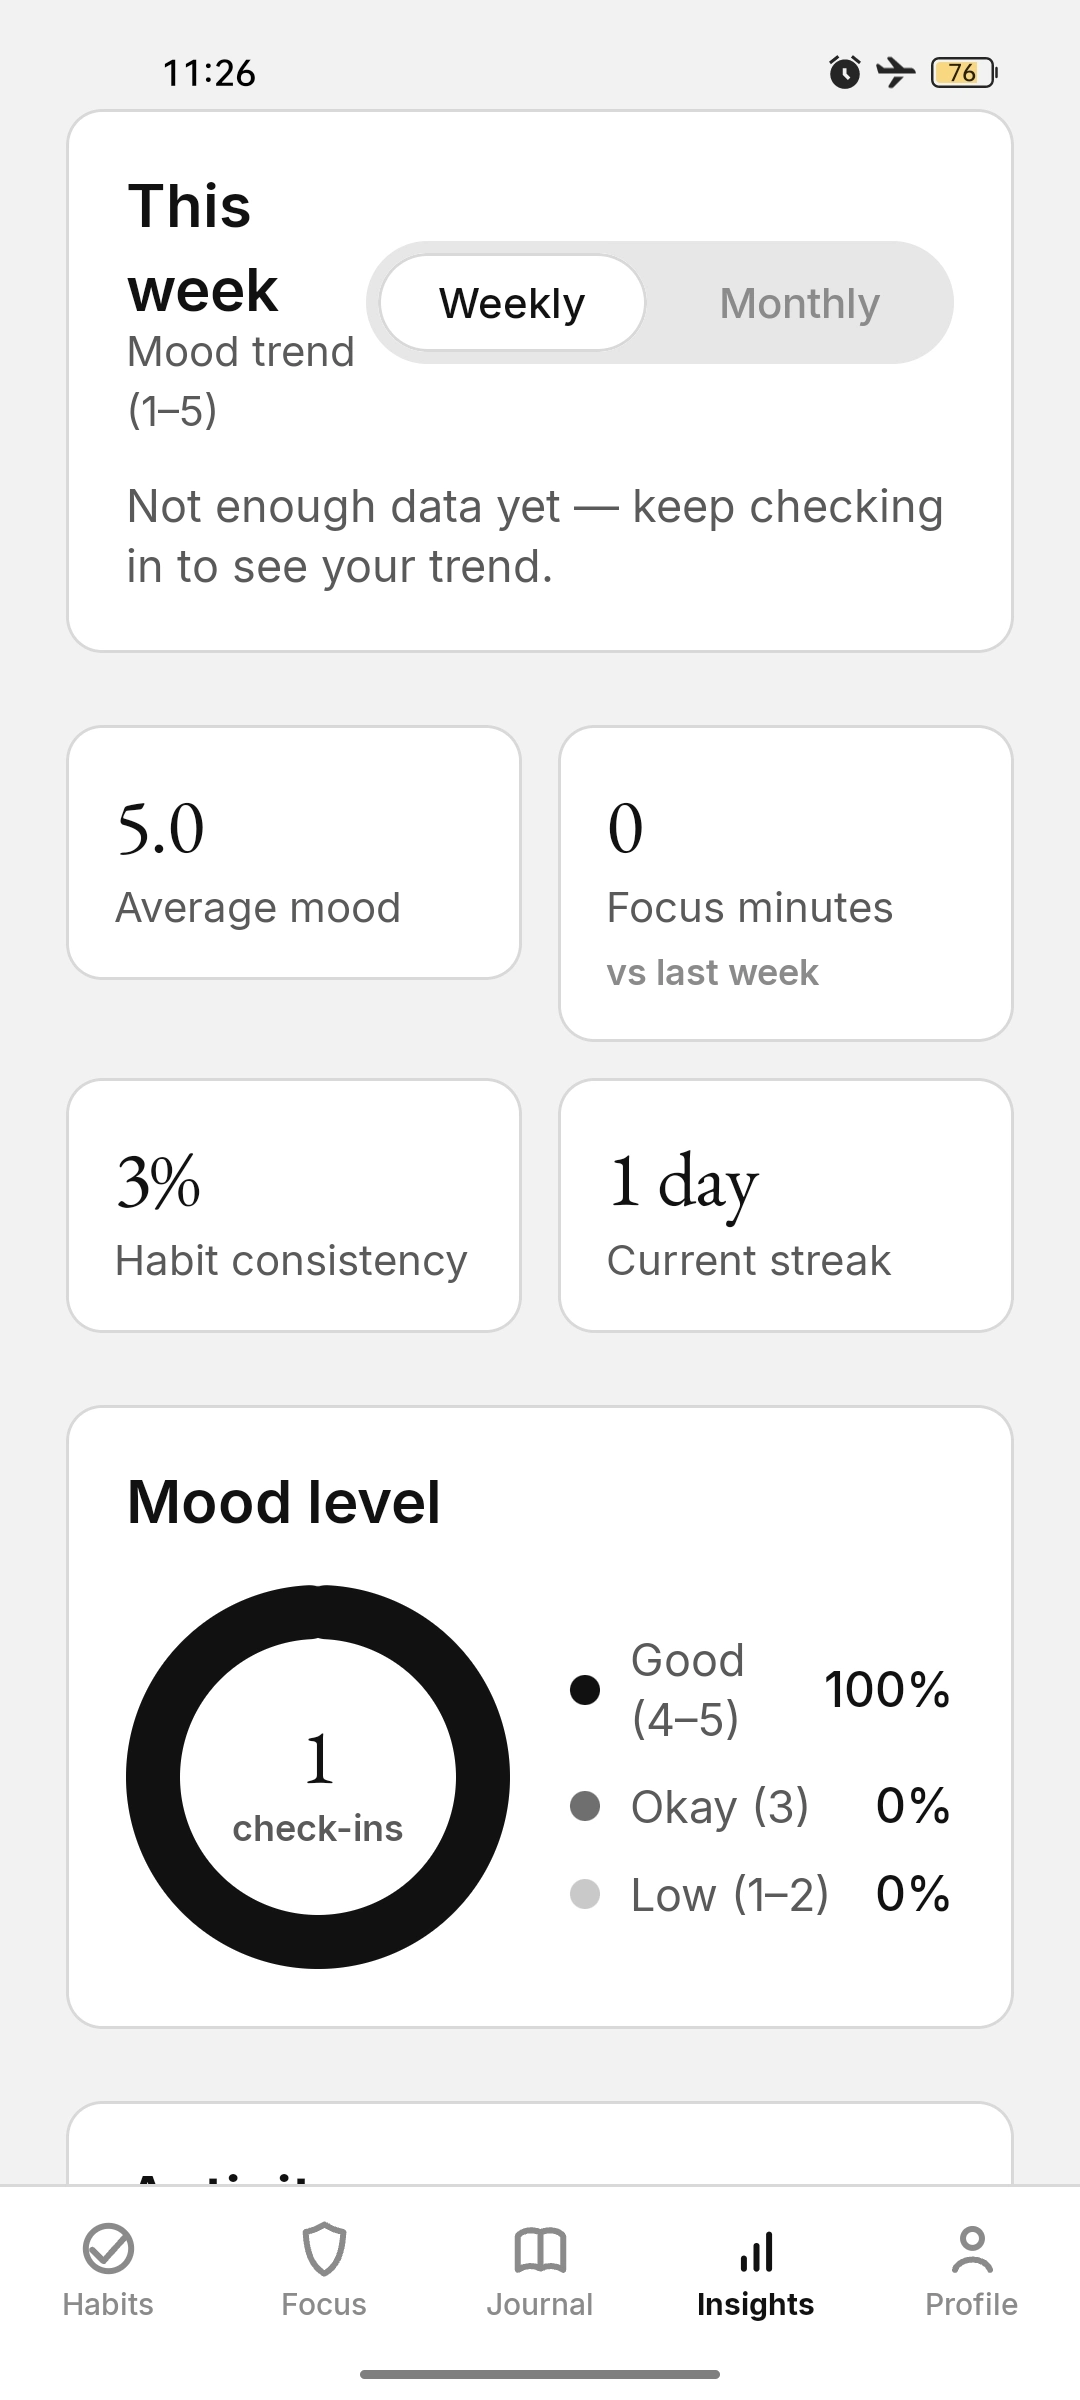
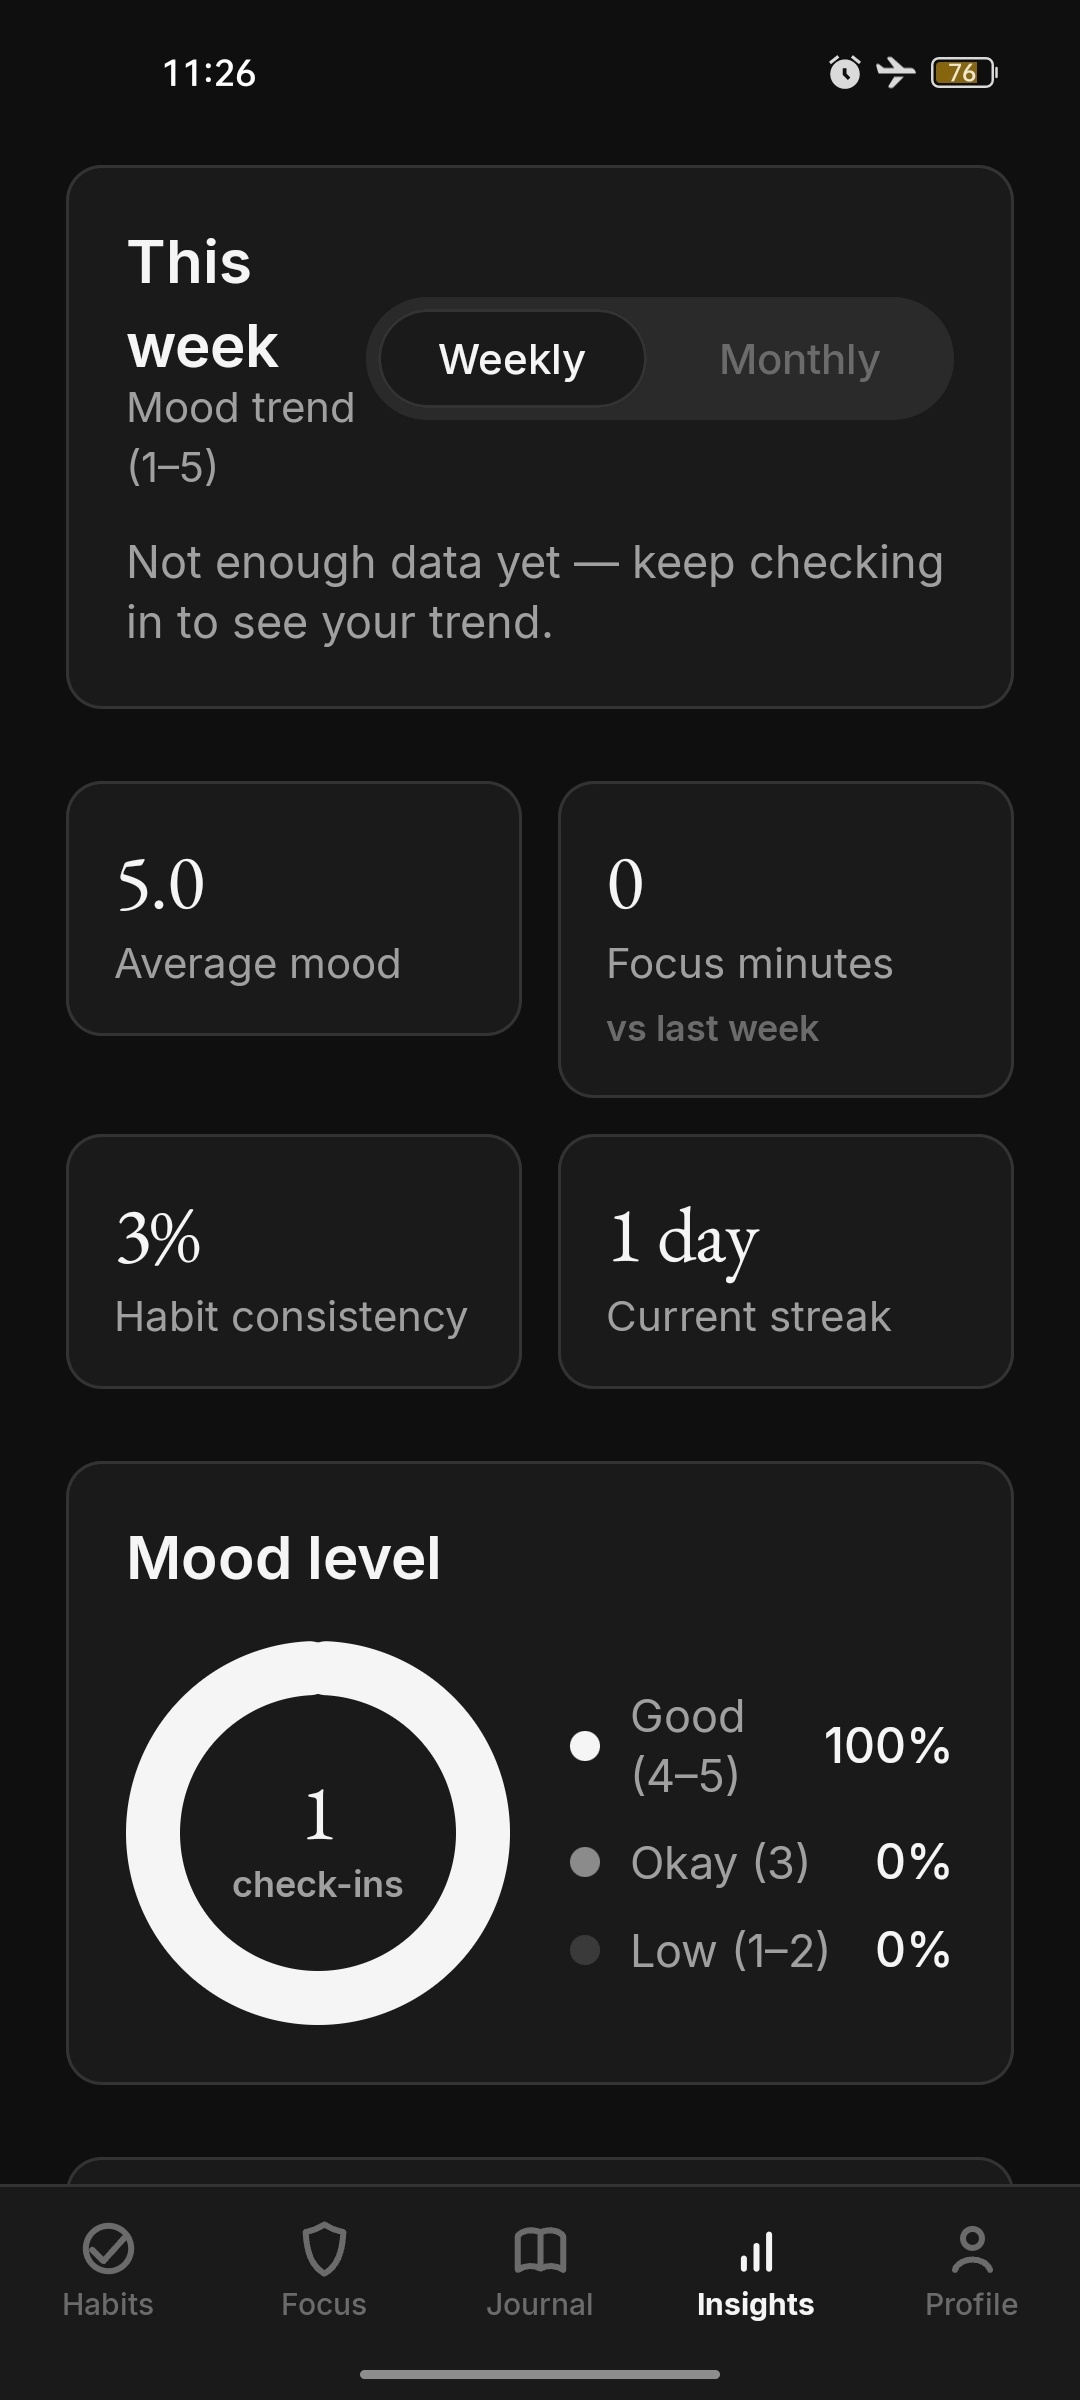
- 7-day and 30-day mood trends with a monochrome distribution donut.
- This-week vs last-week habit comparison bars with signed deltas.
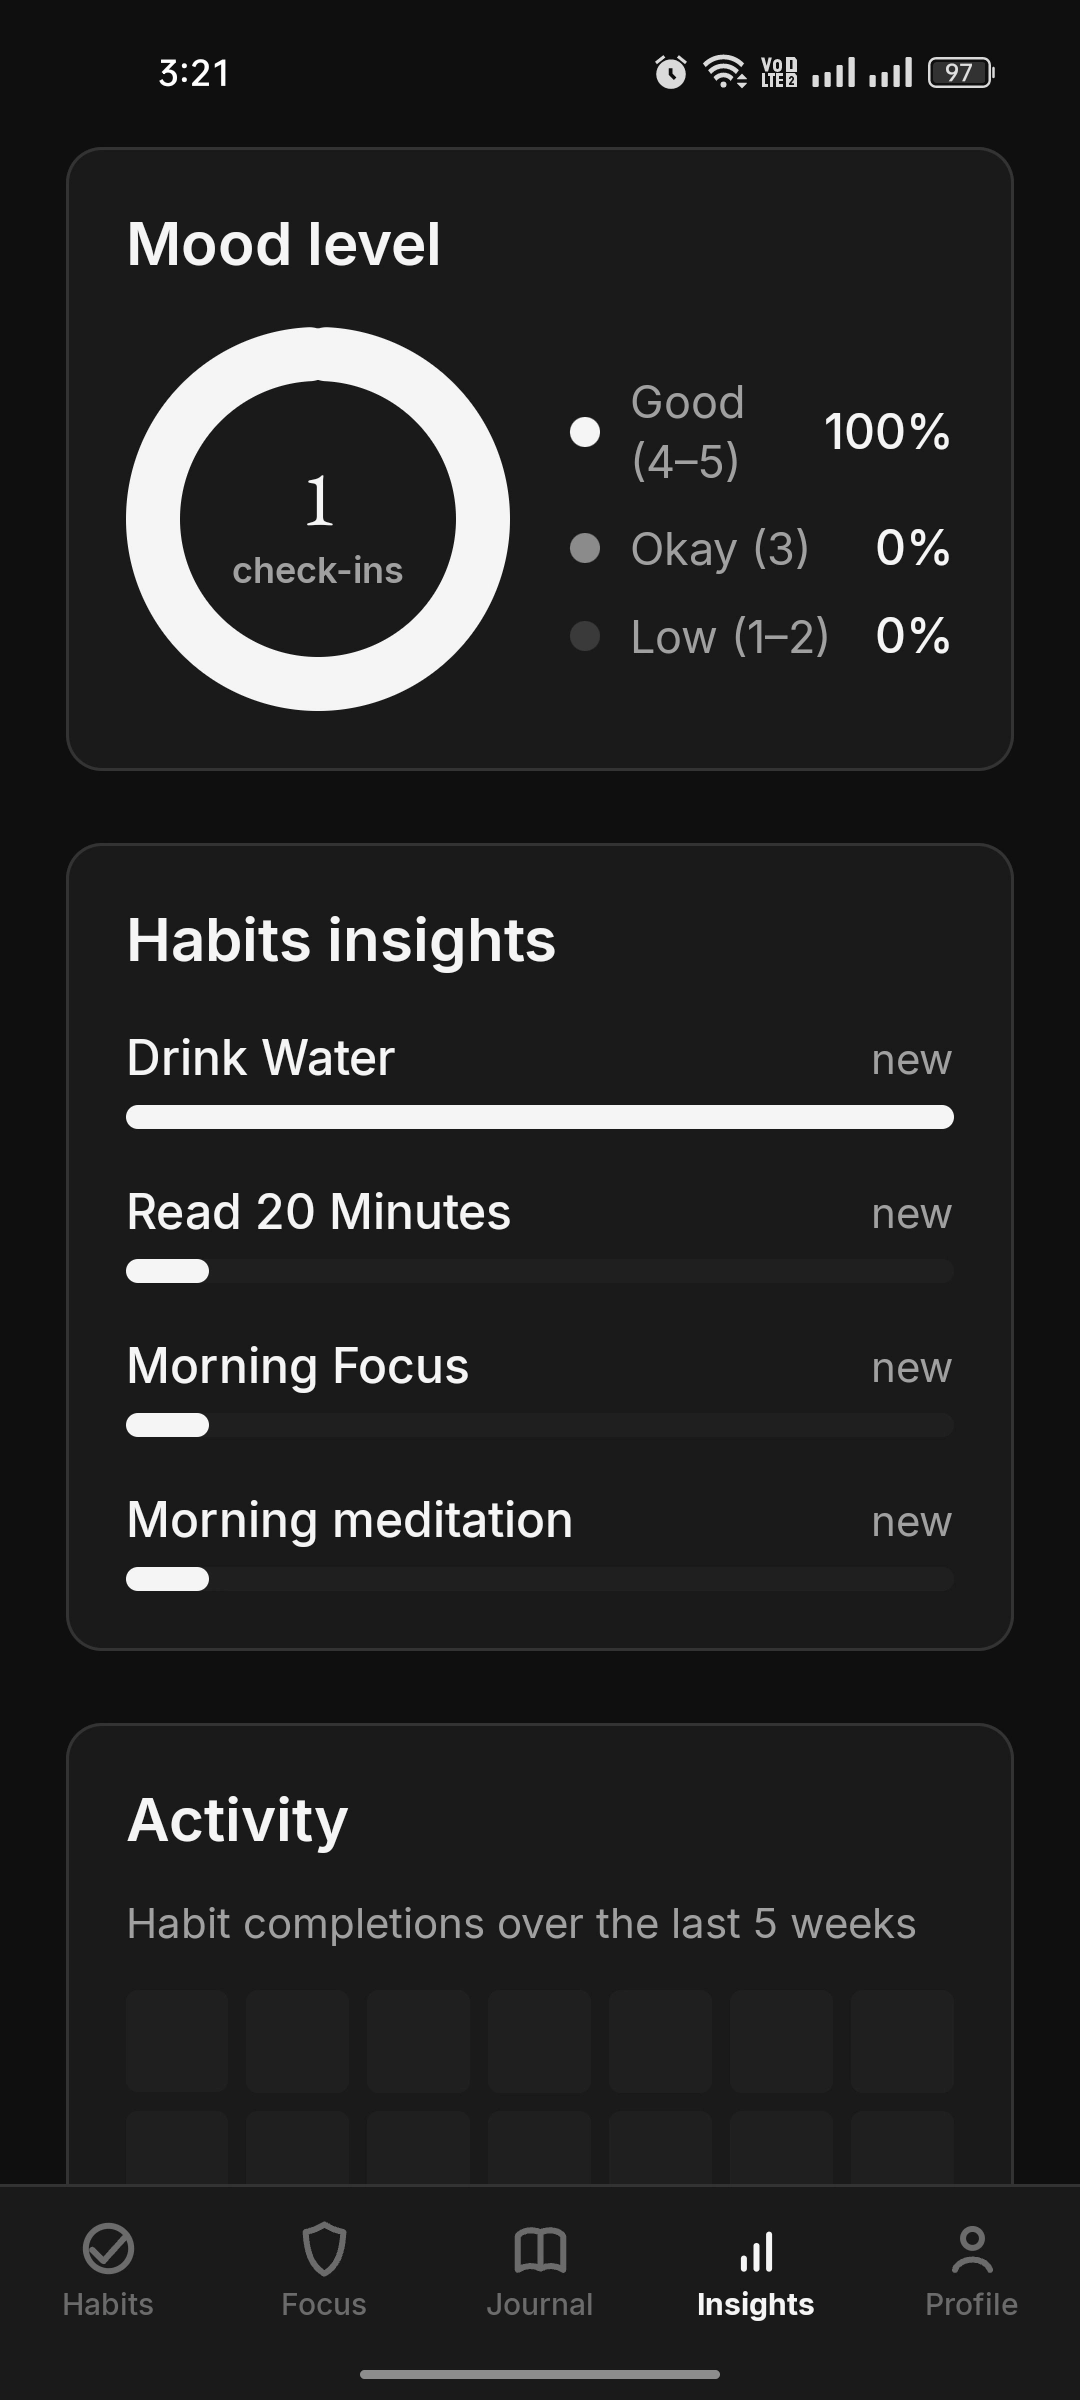
- A 5-week habit completion heatmap and mood–focus correlation.
- Stat tiles for average mood, weekly focus minutes, consistency, and streak.
- CSV export of up to 90 days of focus minutes and average mood.
Coming soon How it stays private
Charts, in strictly monochrome
A six-step gray ramp tells the data apart — no green-up / red-down, just calm clarity.